Experimentation EngineFrom Design To Decision
An A/B testing engine that takes an experiment from design to decision, implementing power analysis, Bayesian decision rules, CUPED, and peeking-safe sequential testing from the formulas.
Headline results
- CUPED variance
- −51.3%
- Peeking false positives
- 21.3% vs 1.0%
- Achieved power
- 0.44 at n=5,000
- Validation
- Known ground-truth effect
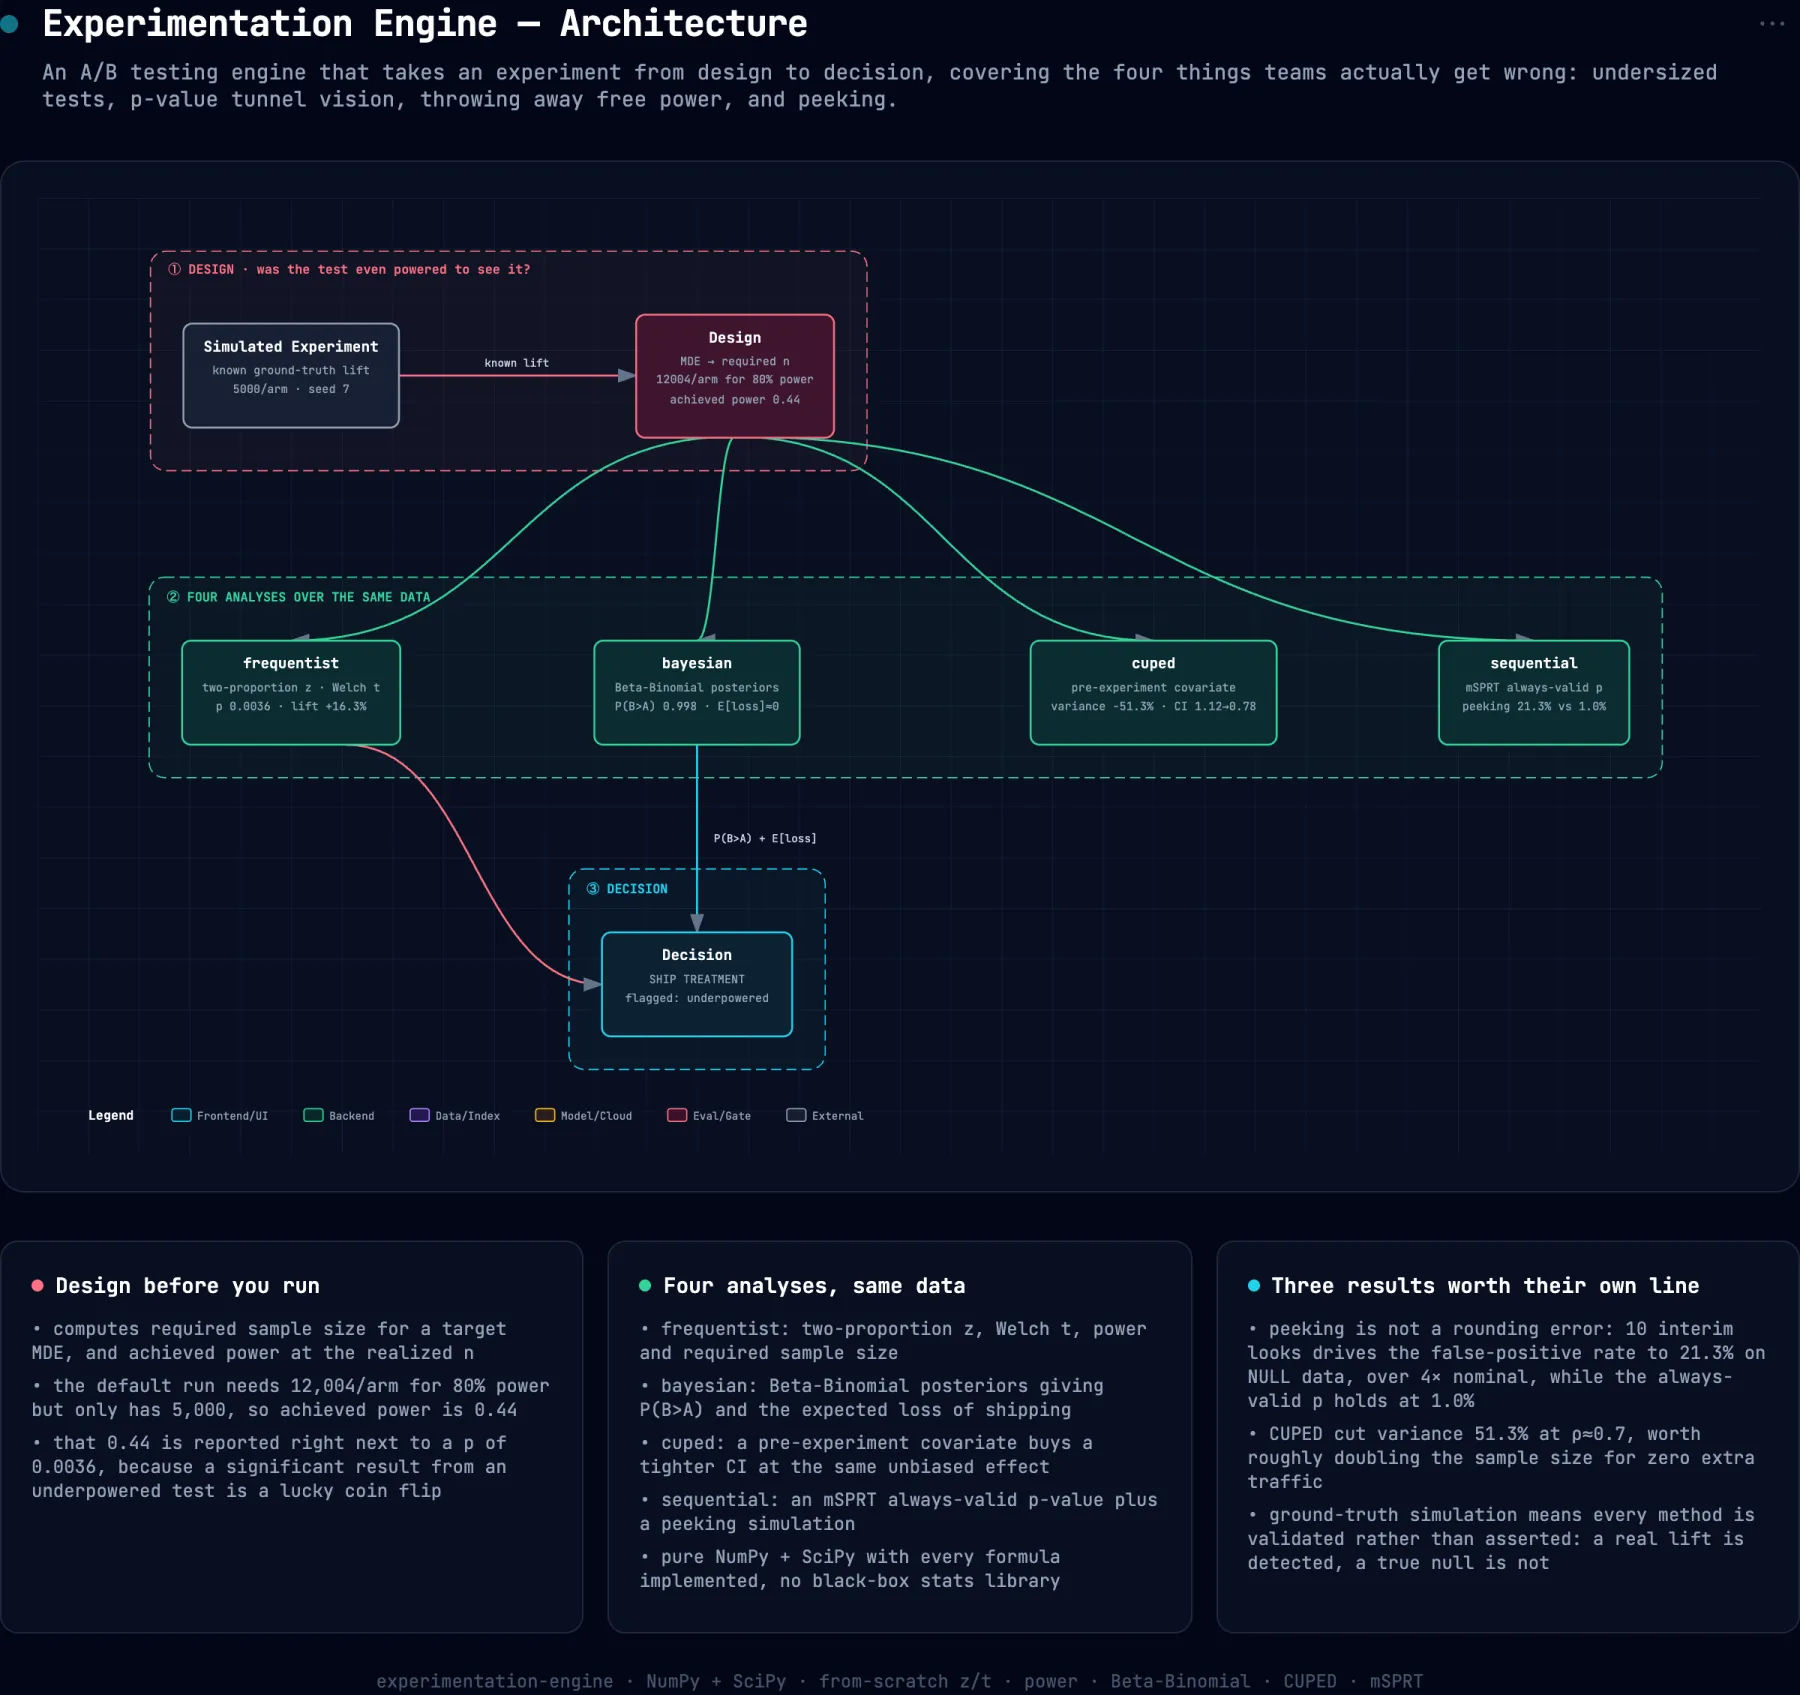
System architecture
Problem
Teams get four things wrong about A/B tests, and they compound. They run undersized experiments, they read p-values as the whole answer, they leave variance reduction on the table, and they peek at the dashboard until it says what they want. Each of those has a known fix, and the fixes rarely ship together in one place you can check.
Approach
Four modules over a simulated experiment with a known true effect, so every method can be validated rather than asserted. Frequentist covers a two-proportion z-test and Welch t-test plus required sample size and achieved power. Bayesian gives Beta-Binomial posteriors, the probability treatment wins, and the expected loss of shipping it. CUPED reduces variance with a pre-experiment covariate. Sequential implements an mSPRT always-valid p-value and simulates peeking to show what naive repeated looks cost you. All of it from the formulas in NumPy and SciPy.
Impact
On the default experiment the design module reports the uncomfortable part first: at 5,000 per arm the test has 0.44 power and needs 12,004 per arm for 80%. The result is significant anyway at p=0.0036, Bayesian agrees at P(treatment wins) 0.998, CUPED cuts variance 51.3% and narrows the confidence interval from 1.12 to 0.78 for free, and the peeking simulation puts naive repeated looks at a 21.3% false-positive rate against 1.0% for the always-valid test.
Decisions & tradeoffs
Implement the statistics rather than import them
z-test, Welch, Beta-Binomial, CUPED and mSPRT are written from the formulas in NumPy and SciPy. It keeps the engine auditable line by line and gives the test suite something specific to be correct about.
Lead the report with power, not with the p-value
The default run is significant and underpowered at the same time. Printing power first makes that contradiction impossible to miss, which is the opposite of how most dashboards order the same facts.
Simulate the bad practice instead of warning about it
Telling people not to peek does not work. Showing that peeking turns a 5% false-positive budget into 21.3%, on their own simulated data, does.
Build spec
- Design
- Needs 12,004/arm for 80% power; ran 5,000 → power 0.44
- Frequentist
- Lift +16.3%, p = 0.0036, significant
- Bayesian
- P(treat > control) = 0.998, expected loss ≈ 0
- CUPED
- Variance −51.3%, CI width 1.12 → 0.78
- Peeking
- Naive 21.3% FP vs always-valid 1.0%
System notes
- Every method is validated against a simulated experiment with a known true effect, not just asserted
- Reports achieved power alongside the p-value, so an underpowered significant result is visible as one
- CUPED buys a 51.3% variance reduction with no extra traffic, which is the cheapest power in experimentation
- The peeking simulation quantifies the practice everyone does: 21.3% false positives against a 5% target
Stack
NumPy · SciPy · CUPED · mSPRT · Beta-Binomial · Power analysis