LLM ObservabilityProduction Tracing and Online Quality Evals
A production monitoring layer for LLM apps: per-request tracing of prompt, tokens, latency, and cost as traces plus spans, with online quality evals on sampled live traffic and a drill-down dashboard on a stdlib plus SQLite core.
Headline results
- Tracing
- Prompt · tokens · latency · cost
- Online evals
- Completeness · groundedness · toxicity
- Metrics
- p50/p95, cost, pass rates
- Core
- stdlib + SQLite, offline
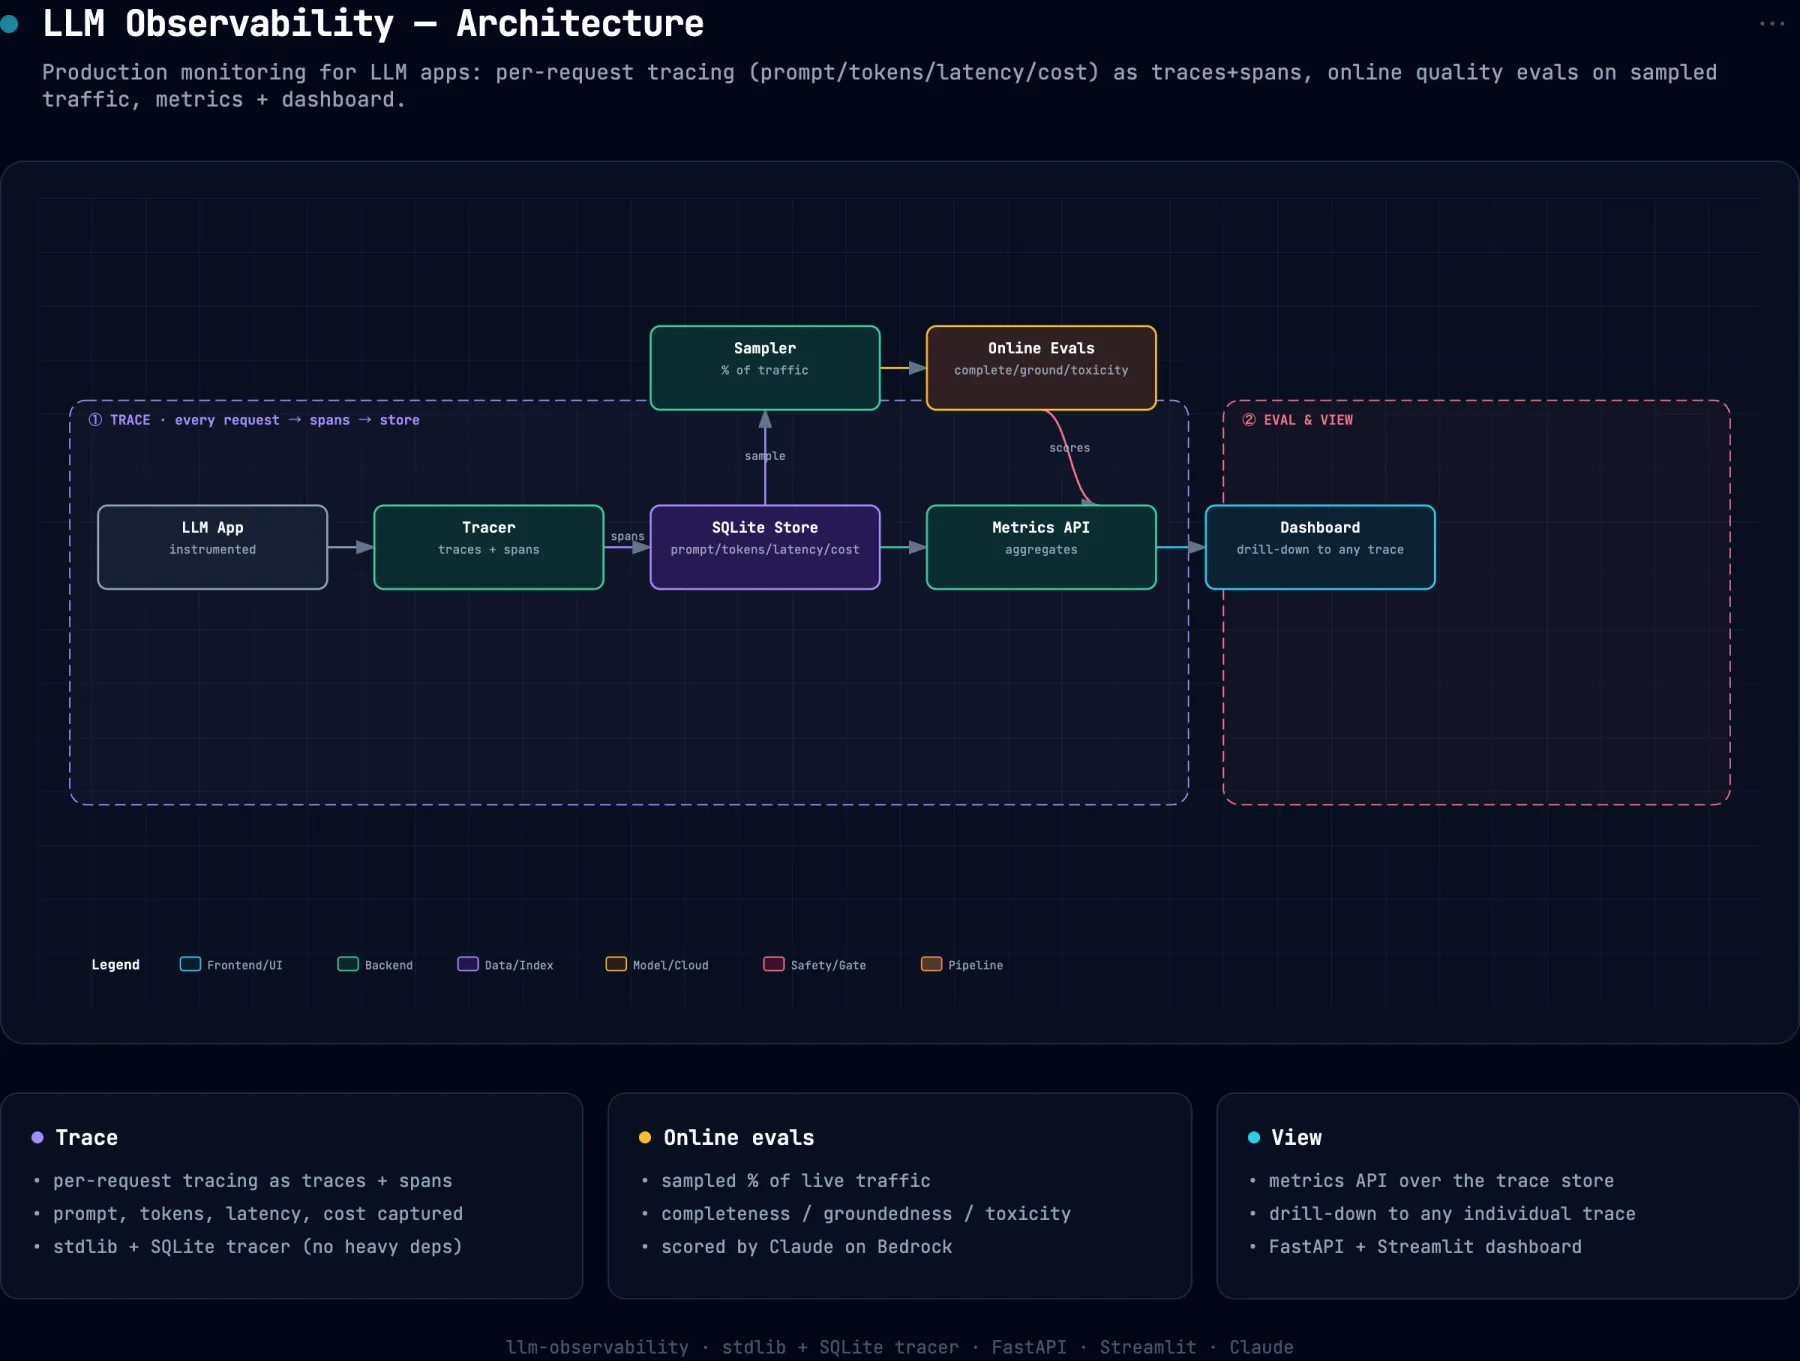
System architecture
Problem
Once an LLM app is live, the operational questions are immediate: what is my p95 latency, what is this costing, and what fraction of answers are ungrounded or refusals, and which traces. Teams either fly blind or buy a SaaS observability platform that needs an account and an API key to function.
Approach
A Tracer exposes trace and span context managers that auto-capture latency, tokens, and cost, instrumenting any app in about six lines. Each trace rolls up its spans (retrieval, generation, tools) with p50/p95 latency, tokens times per-model pricing, and errors, where a failed span marks the trace as error. Online quality evaluators run on sampled generation spans (completeness, verbosity, toxicity, groundedness) as heuristic key-free checks so observability works offline, and an LLM-as-judge evaluator drops in with the same signature. A SQLite store holds traces, spans, and evals behind a metrics module, a FastAPI read API, and a Streamlit drill-down dashboard. A MockLLM provider runs fully offline and points at Claude when a key is present.
Impact
The system delivers Langfuse-style per-request tracing, cost accounting, and online quality monitoring that is self-contained and needs no vendor platform. Demo traffic deliberately includes a refusal, an empty response, an ungrounded answer, and a failed request, so eval pass rates and error rate are non-trivial out of the box.
Decisions & tradeoffs
Traces and spans as the unit
One trace per request, spans for retrieval, generation, and tools capture latency, tokens, and cost. A failed span marks the whole trace as error so error rate is tracked directly.
Key-free heuristic evals
Online evaluators are heuristic and key-free so quality monitoring works fully offline. An LLM-as-judge evaluator drops in later behind the same signature.
Offline-first with real LLM opt-in
A MockLLM provider makes the demo self-contained with no account or API key. Setting an Anthropic key routes generations to a real Claude model for real tokens and cost.
Build spec
- Core
- Python stdlib + SQLite
- Serving
- FastAPI + uvicorn
- Dashboard
- Streamlit drill-down
- Model
- Claude or MockLLM
- Endpoints
- /chat, /metrics, /traces, /traces/{id}
System notes
- Trace and span context managers instrument any app in about six lines
- Online evals (completeness, verbosity, toxicity, groundedness) on sampled traffic
- Metrics API: p50/p95 latency, cost, error rate, and eval pass rates
- Stdlib plus SQLite core runs fully offline, points at Claude with a key
Stack
Python · SQLite · FastAPI · Streamlit · LLMOps · Claude