Timeseries Anomaly DetectionA Bench, Not A Plot
A time-series anomaly detection bench with known ground truth: seven detectors scored on precision, recall, F1 and point-adjusted F1 over a series with injected spikes, level shifts and variance bursts.
Headline results
- IQR on raw seasonal data
- adj-F1 0.00
- Same detector on STL residual
- 0.956
- Isolation forest
- 0.741
- Detectors
- 7, labeled ground truth
System architecture
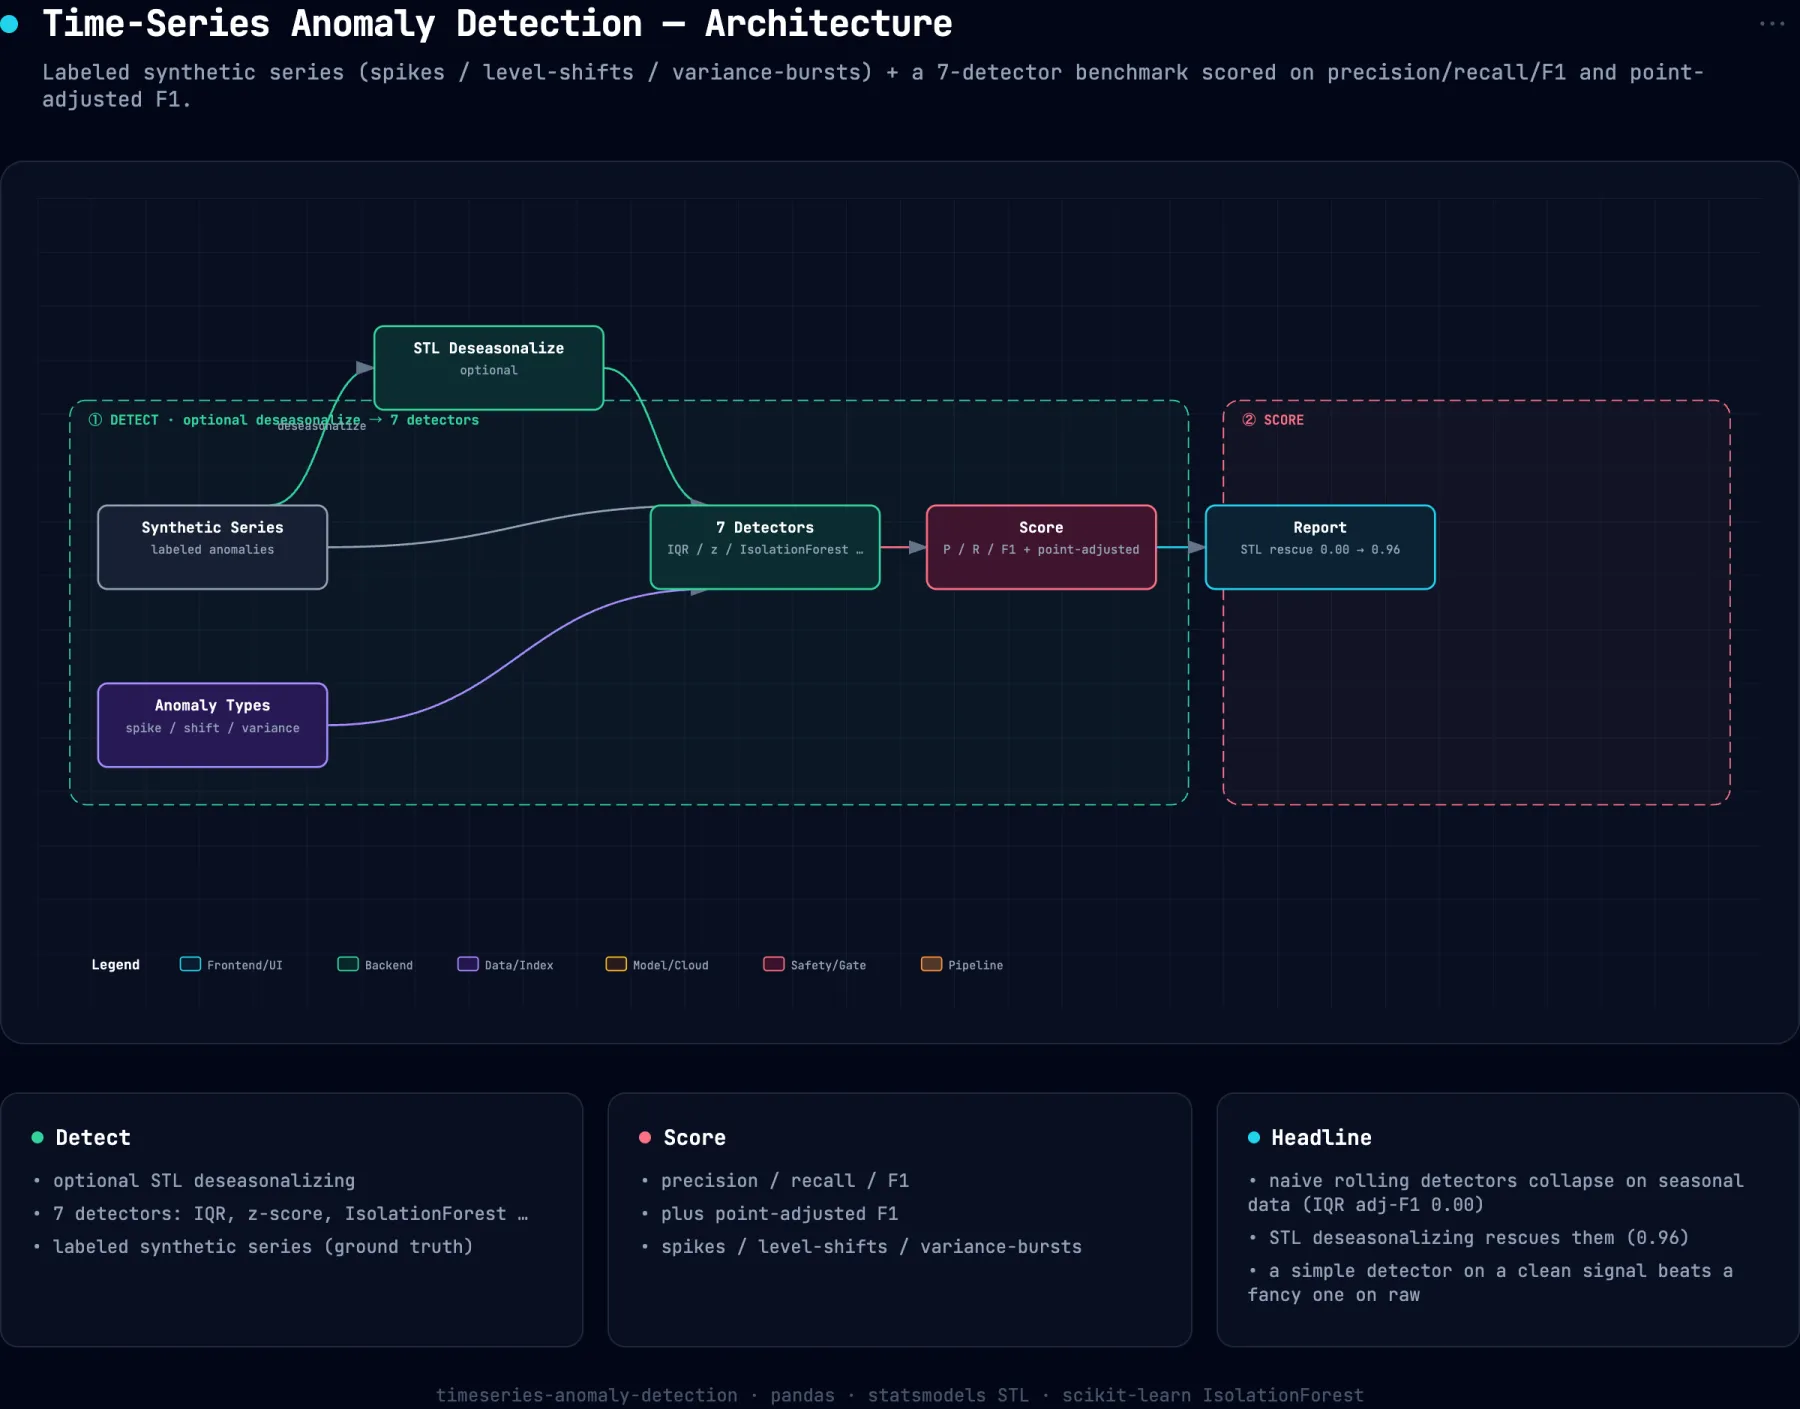
Problem
Anomaly detection demos plot a series, circle the obvious spikes, and stop. Without labels there is no precision, no recall, and no way to know whether the detector would survive a seasonal signal, which is what almost all real operational data has.
Approach
Generate a synthetic series with the anomaly ground truth recorded: point spikes, sustained level shifts, and variance bursts injected at known indices. Run seven detectors over it, rolling z-score, IQR fences, EWMA residual, STL residual, isolation forest on lagged features, and the two naive detectors re-run on the STL remainder. Score each on precision, recall and F1, plus point-adjusted F1, which is the metric operational teams actually care about because catching a sustained incident once is catching it.
Impact
Naive rolling detectors collapse on seasonal data, with IQR scoring a point-adjusted F1 of 0.00. Running the same detector on the STL remainder takes it to 0.956, the best score in the table, ahead of isolation forest at 0.741. The transferable lesson is that a simple detector on a clean signal beats a sophisticated one on the raw signal, and the work belongs in the preprocessing rather than the model.
Decisions & tradeoffs
Generate the data so the labels exist
Real telemetry without labels can only support a qualitative claim. Injecting anomalies at recorded indices costs realism and buys the ability to say precision 0.817 and mean it.
Score point-adjusted F1 as well as raw
Raw F1 punishes a detector for flagging only part of a sustained level shift, which is not how an operator experiences it. Both metrics are reported because they answer different questions and the ranking changes between them.
Run the naive detectors twice
Including rolling z-score and IQR both raw and on the STL remainder isolates the variable. The comparison is the finding, and it would have been invisible if only the deseasonalised versions had shipped.
Build spec
- Series
- n = 2,000, 165 anomalous points, 8.2% rate
- iqr_deseason
- adj-F1 0.956, best in table
- rolling_zscore_deseason
- adj-F1 0.873
- isolation_forest
- adj-F1 0.741
- Detectors
- 7, including 2 deseasonalised variants
System notes
- Ground truth is recorded at injection time, so precision and recall mean what they say
- Deseasonalising takes the worst detector in the table to the best one, without changing the detector
- Point-adjusted F1 is reported alongside raw F1, because a sustained incident caught once is caught
- Isolation forest, the sophisticated option, finishes behind a rolling IQR on a cleaned signal
Stack
pandas · statsmodels STL · scikit-learn · Point-adjusted F1