Token EconomicsThe Cost Question, Measured
The LLM cost interview question answered with measured data: a budget calculator, a streaming TTFT harness, and the routing and caching economics that decide when the optimisations are worth it.
Headline results
- All-large
- $60,000/day
- 50% routed
- $31,600/day
- Cost vs quality
- 52.7% cost, 92.5% quality
- Latency
- 20 real streamed generations
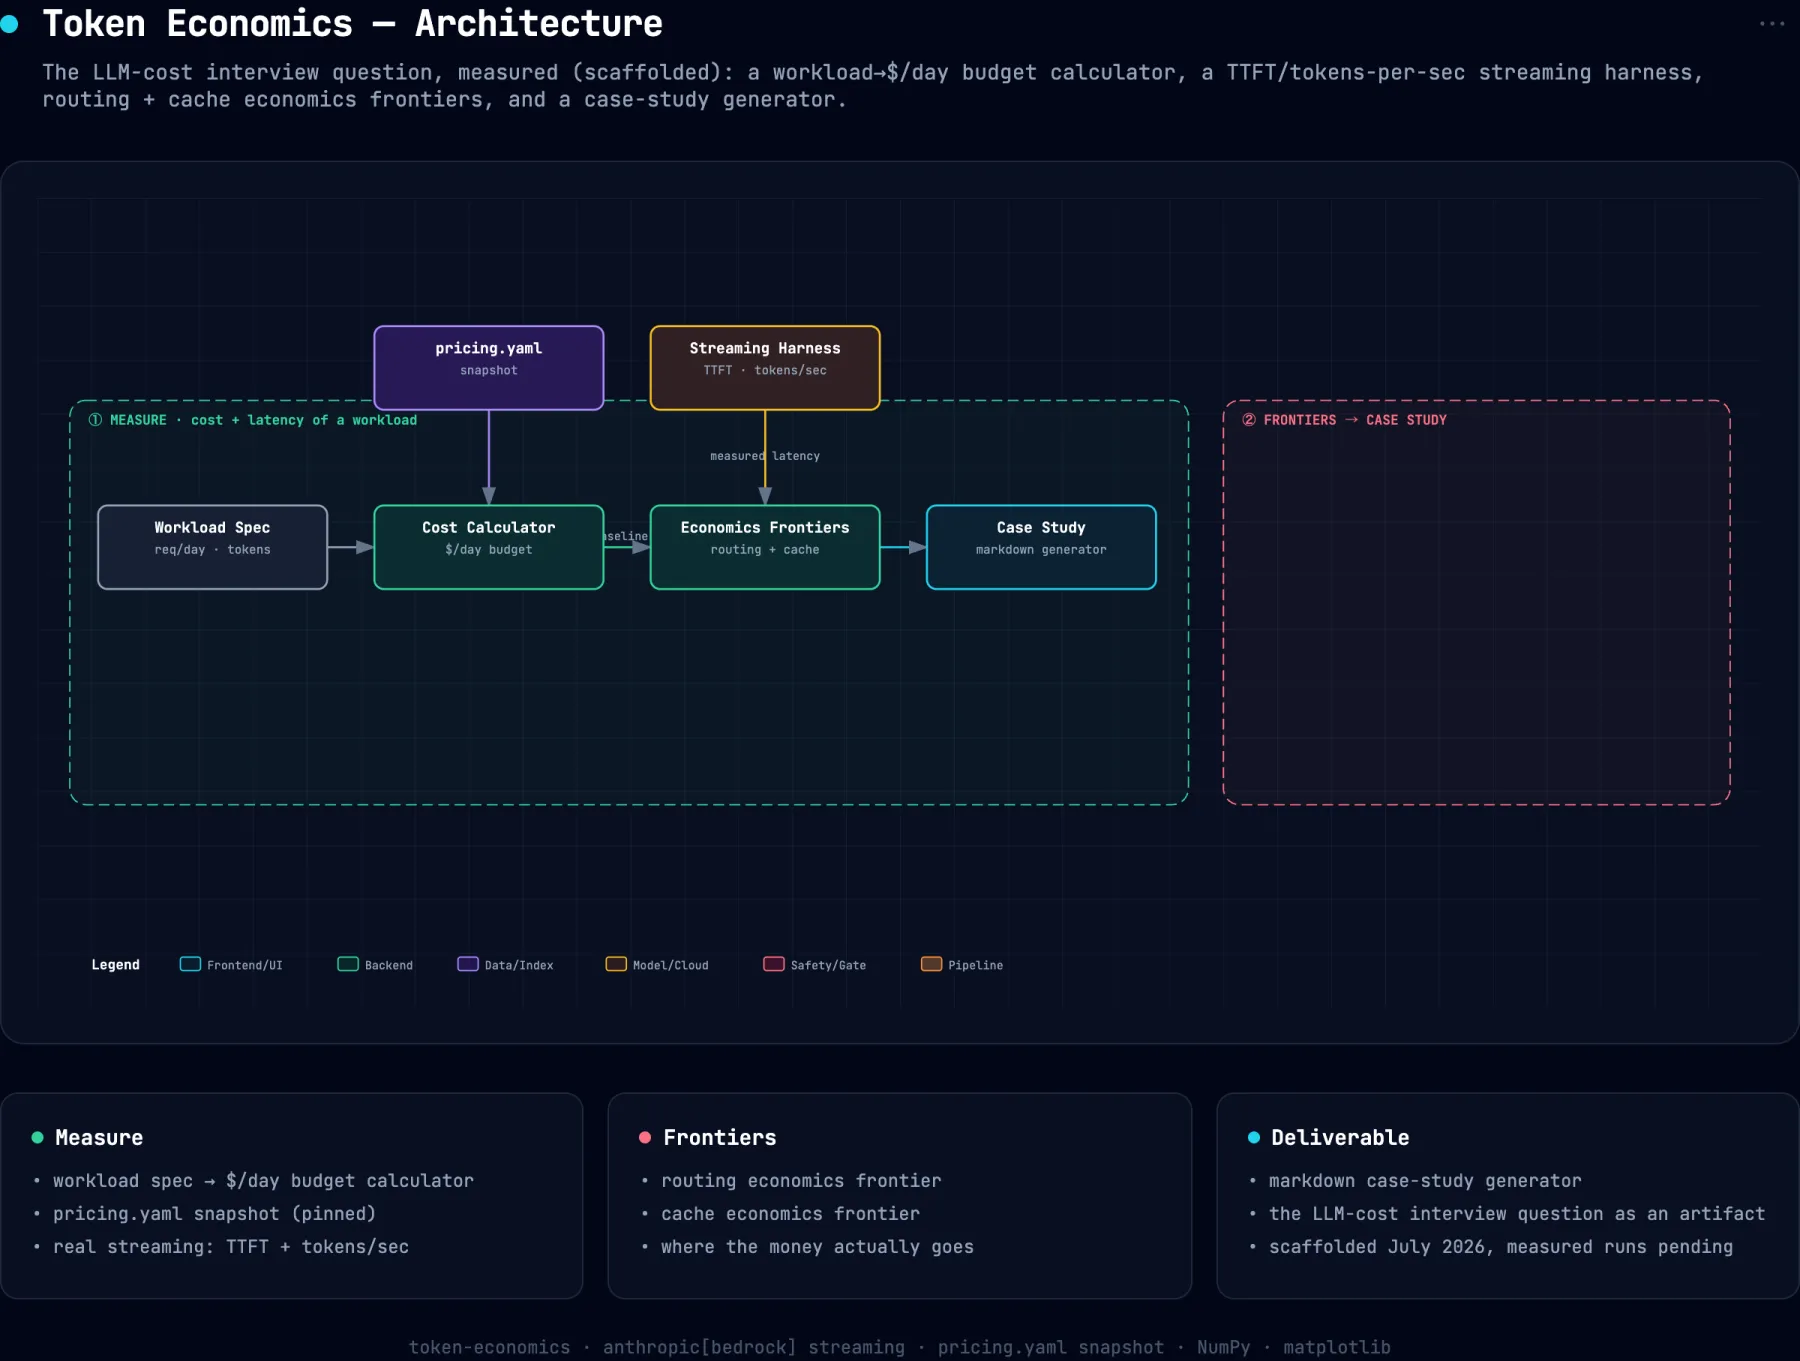
System architecture
Problem
Every LLM engineering interview reaches the same question. You have 100,000 users at ten interactions a day and two thousand tokens each; what does that cost per day, per user, what is your time-to-first-token budget, and when does routing or caching pay for itself. Most candidates estimate. The answer is arithmetic, and the inputs are measurable.
Approach
Prices live in a labelled point-in-time YAML snapshot rather than in code, so the calculator is auditable and its staleness is visible. A budget calculator turns a workload spec into dollars per day, month, interaction and user across model tiers. A streaming harness measures real time-to-first-token and tokens per second against Bedrock at p50, p95 and p99. Routing and caching frontiers compute where each optimisation starts paying, including the false-hit penalty a semantic cache carries.
Impact
The frontier is the deliverable. On the reference workload, all-large costs $60,000 a day and all-small costs $3,200; routing half the traffic to the small model lands at $31,600, which is 52.7% of the cost for 92.5% of the quality. Latency is measured, not assumed, across 20 streamed Bedrock generations at temperature 0. Cost arithmetic and latency measurement are reported in strictly separate sections so a computed number is never mistaken for an observed one.
Decisions & tradeoffs
Treat prices as data with an expiry
Model prices move. Hardcoding them into a calculator produces confident wrong answers months later, so they sit in a dated YAML snapshot the README tells you to re-verify before quoting anything.
Label the quality numbers as policy inputs
The routing frontier needs quality scores per tier. Those are placeholder policy inputs here, not measurements, and the sibling router project is where they get measured. Presenting an assumed input as a result is the standard way cost analyses mislead.
Measure TTFT by streaming, not by total latency
Users feel first token, not last. The harness records wall clock to the first streamed delta separately from throughput, because a fast total with a slow first token is a bad interactive experience and an averaged number hides it.
Build spec
- Workload
- 100k users × 10/day × (1,500 in + 500 out)
- All-large
- $60,000/day · $18.00 per user per month
- All-small
- $3,200/day · 5.3% of cost at 85% quality
- 50% routed
- $31,600/day · 52.7% cost · 92.5% quality
- Latency
- 20 streamed Bedrock generations, temp 0, TTFT + tok/s
System notes
- Pricing is a labelled data file with a snapshot date, not constants buried in the calculator
- Computed arithmetic and measured latency are kept in separate labelled sections so neither borrows the other's credibility
- Every command runs key-free and deterministic in mock mode, with explicit seeds and no argless randomness
- The cache curve prices the false-hit penalty, not just the hit rate, so the saving is net
What this does not show
- Prices are a dated snapshot in a YAML file; re-verify against current provider pricing before quoting any dollar figure.
- The quality scores on the routing frontier are policy inputs, not measurements. The router project is where they get measured.
Stack
AWS Bedrock streaming · Pricing snapshot · NumPy · matplotlib · Cost modelling